Dashboards

Last updated:

|Edit this page

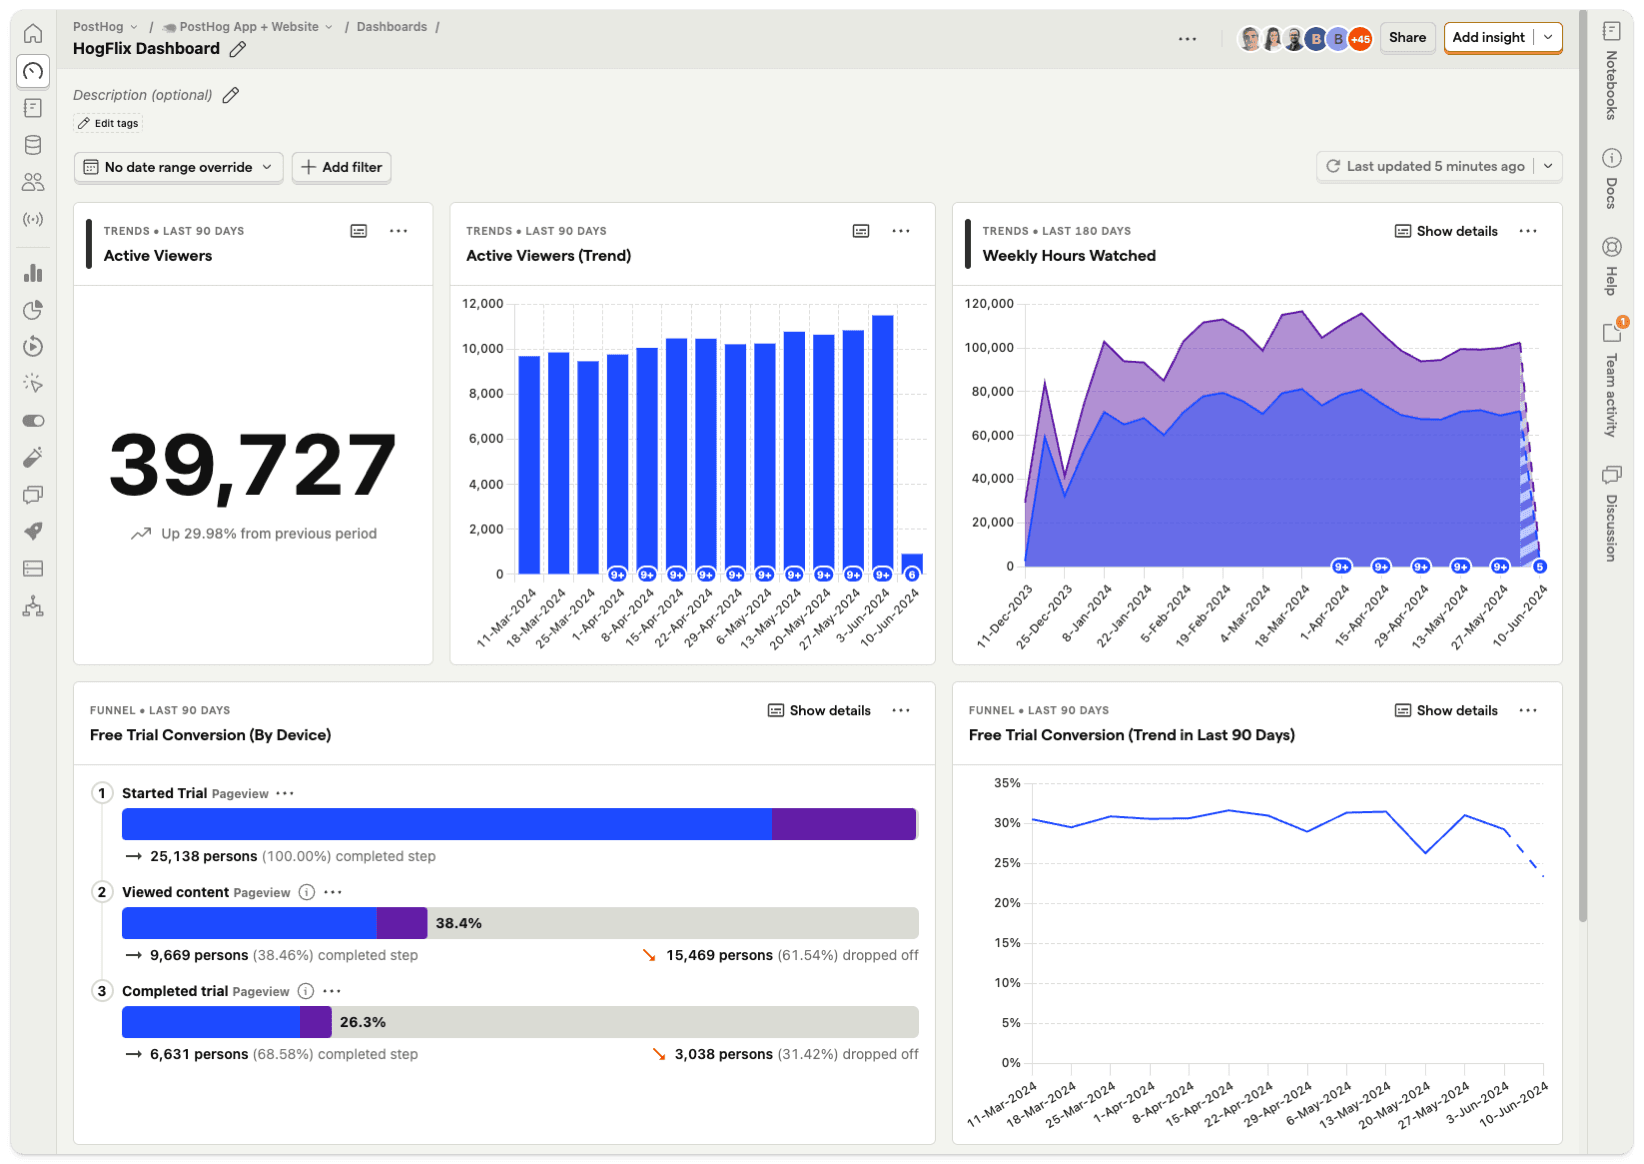
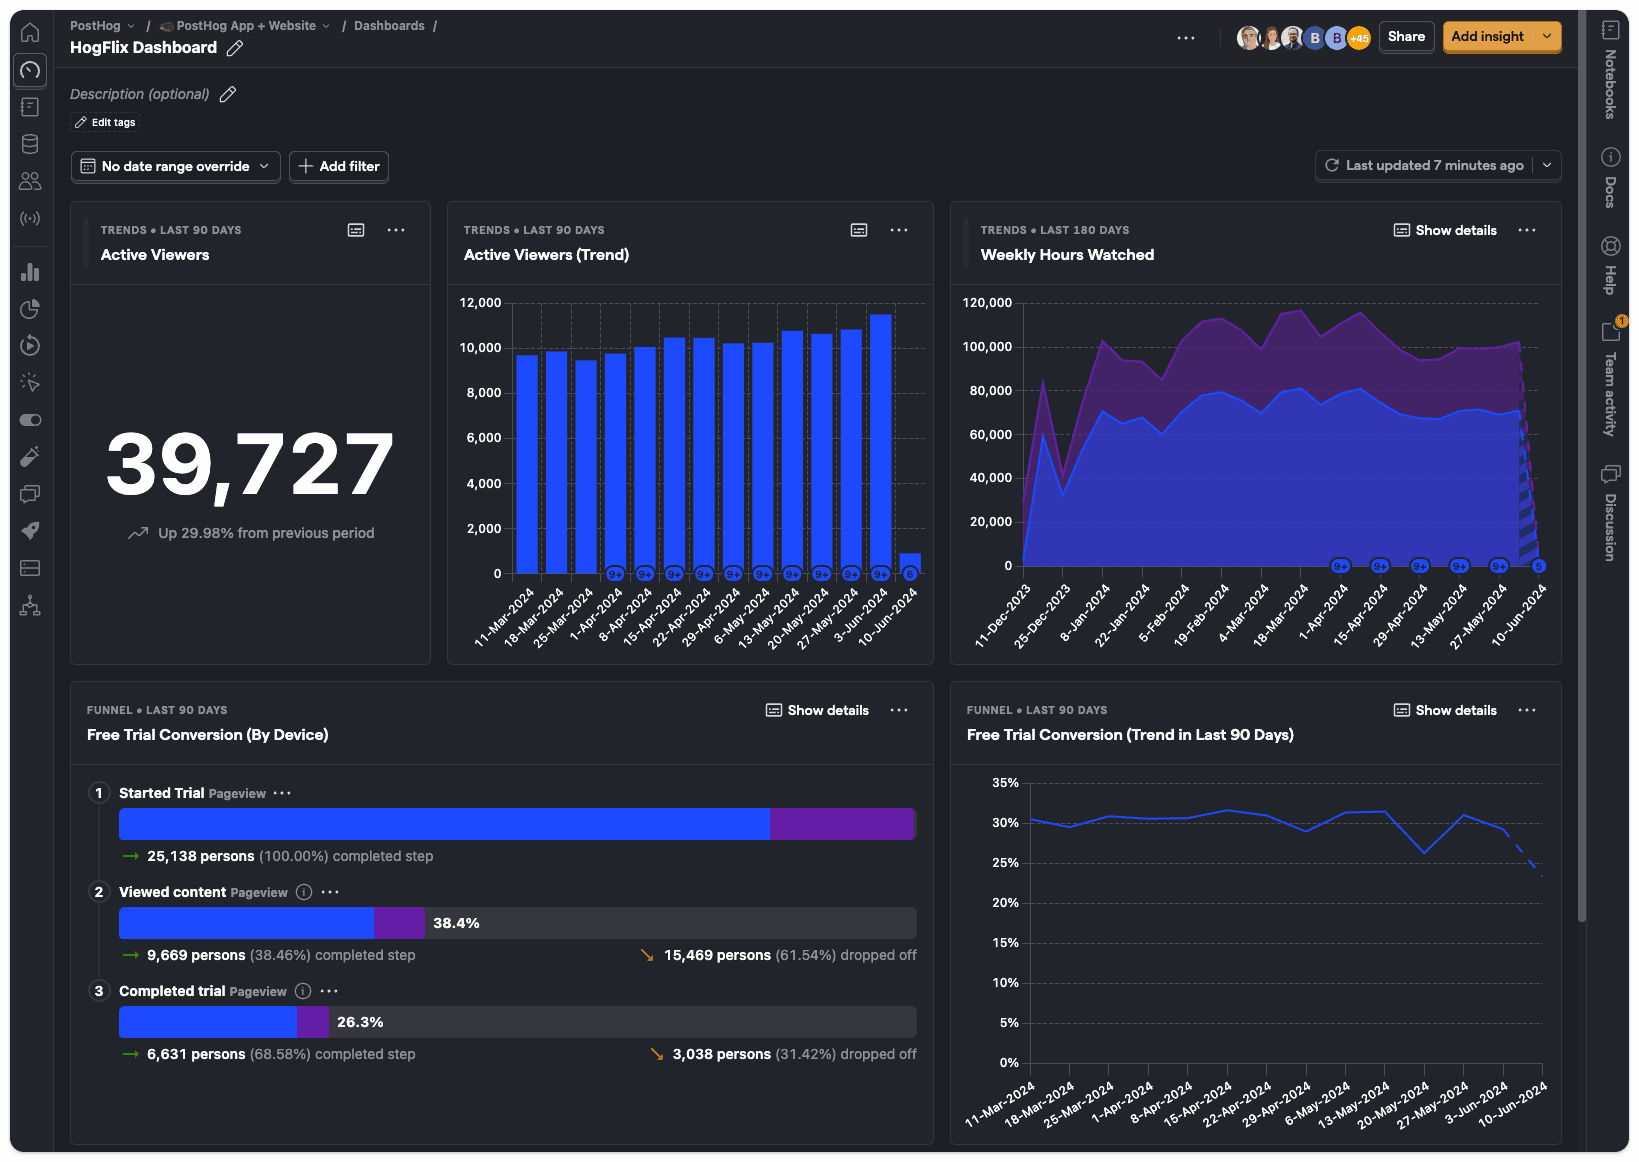
Dashboards are the easiest way to track all your most important product and performance metrics.

Unlike notebooks, which are ideal of adhoc analysis of specific issues, dashboards are designed for tracking common metrics over time.

You can create a new dashboard from scratch, but we also offer numerous dashboard templates for tracking things like website metrics, product health metrics, and metrics for large language models.

Example of a dashboard

Creating a new dashboard

  1. Click on Dashboards in the left hand navigation and then New Dashboard.
  2. You can create a dashboard from a list of available templates, or select Blank Dashboard to start from scratch.
  3. Name your dashboard, add some optional details if desired.
  4. Your dashboard will be empty – click +New insight to create an insight to add. Dashboards support all the core product analytics insights.
  5. Click Save & add to dashboard when you've created your insight.

If you already have some insights set up, an alternative approach is to click Add to dashboard in any insight.

Important: Insights can appear on multiple dashboards at the same time, so you don't have to create multiple copies of the same insight.

Dates and filters

Date range overrides

New dashboards are set to 'No date range overide' by default. This means all insights will use the date range applied in their configuration.

Changing the date range on a dashboard forces all the insights to use the same date range, but this doesn't impact the date range that's shown when viewing an individual insight.

Dashboard filters

Dashboards also support most of the same filters as individual insights, including:

  • Event properties: Properties stored on event, such as the Current URL when the event was triggered.
  • Person properties: Properties of individual users, such as company_name.
  • Feature flags: Filtering for users with a specific feature flag enabled.
  • Group properties: Account-level properties, like organization_id, which are only available if you have the group analytics add-on.
  • Cohorts: Filtering by cohorts of users you've already created.

Using filters on dashboards is a useful way to compare usage between different types of users without recreating insights over and over.

You could, for example, duplicate a dashboard – click on the '...' menu and click 'Duplicate' – and apply different filters to each version of the dashboard.

Dashboard options

Editing the layout

You can move and resize all the insights on a dashboard by entering the 'Edit layout' mode.

You can do this in three ways:

  • Tap 'E' on your keyboard
  • Click on the '...' icon at the top of the dashboard and click 'Edit layout'
  • Click on the '...' icon on any insight card and click 'Edit layout'

Tapping 'F' enables fullscreen mode.

Note: Dashboards have separate layouts for mobile and desktop. Shrink your viewport until insights are a single column to edit the mobile one.

Adding text cards

Clicking the dropdown on the 'Add insight button' reveals the option to add a text card to your dashboards.

Text cards support Markdown formatting for text. You can also drag and drop images.

You can use text cards to annotate your dashboard – useful for adding context for other users of the dashboard. For more in-depth analysis, however, we recommend creating a notebook.

Sharing a dashboard

By clicking 'Share' in the top right corner you can:

  • Restrict edit access to certain members within a project. Dashboards can be shared either by members with administrator privileges or by the dashboard creator (Teams add-on required).

  • Create a link to share your dashboard publicly, or embed your dashboard on a website. Read more about this in our sharing and embedding docs.

Auto refresh

You can manually refresh a dashboard at any time, but you can also set it to automatically refresh.

To do so, click the dropdown arrow next to refresh button, turn on auto refresh and choose your refresh interval.

This is useful if you have a PostHog dashboard on a TV screen for others to see.

Important: Auto refresh only works when the browser tab is active.

Questions? Ask Max AI.

It's easier than reading through 569 docs articles.

Community questions

  • Pieter
    2 days ago

    Filter Group for Dashboard

    Hi, it looks like it's not possible at the moment to apply a filter group to a dashboard? Is this on the roadmap? Saves us from applying the filter groups to each insight individually.

  • Jake
    a month ago

    Resizing

    I'm not able to resize any of the insights on my dashboard. I'm in Edit Layout mode and I see the handles for resizing but no matter what I do, the component won't resize. I've tried different widths for my browser in case it was layout specific but no luck.

    • Guillaume
      Edited a month ago

      Same here. Tried clearing cache and force reloading, also tried with a brand new dashboard. I can drag and move, but cannot "pick" the handles and resize, which worked fine a few weeks back when I created my dashboards.

  • Juliette
    3 months ago

    Rearrange charts ?

    Is it possible to change the order of the charts on the dashboard ?

    • Andy
      3 months agoSolution

      Yes. Click on the '...' menu and then 'Edit layout' on any dashboard.

      Alternatively, pressing 'E' key will enabled the layout mode as well.

  • Josh
    4 months ago

    Filtering SQL insights directly from data warehouse

    Consider a dashboard where we are trying to get a holistic view of a certain company of users in our application. We send this company data as a group to posthog, which makes it really easy to filter our event based dashboards.

    But now we want to add company level data from our MySQL Data Warehouse. How can we dynamically apply the same filters? Is it even possible? For example, something like

    select count(*)
    from pending_users
    where company_uuid = {filter.group.company.id}

    After a bit of digging, I think at a minimum we would need the extended group properties feature, like is available for person properties/joins but even then, probably not quite as straightforward to achieve what I had in mind. Any suggestions?

    • Martin
      Edited 23 days ago

      I second that. As an example we have 15 Sql Insights on a Dashboard and if we duplicate the dashboard with the Insights we need to edit those 15 Insights to adjust for the name of our specific event.

      select count()
      from s3_impulse_prod_humans
      where EventId = 'nameofevent'

      We would love to be able to set a $EventId variable at the Dashboard level so we can deploy new Dashboard super fast without manually editing all SQL requests.

  • Jonathan
    5 months ago

    Adding recent recording to dashboard

    Hi, is there a way to add "recent recordings" (like the widget on the home screen) to a dashboard? Thanks!

    • Paul(he/him)
      5 months agoSolution

      hey, there is, using hogql!

      you can add a sql insight like

      select person.properties.email, min_first_timestamp as start, recording_button(session_id)
      from raw_session_replay_events
      where min_first_timestamp >= now() - interval 1 day
      and min_first_timestamp <= now()
      order by min_first_timestamp desc
      limit 10
    • Jonathan
      Author5 months ago

      Thank you Paul! Just a small correction to your query - in order to save as view, recording_button(session_id) must have an alias (or at least this is what to button tooltip says)

  • Alex
    5 months ago

    Breakdown filter for dashboard?

    Is there a way to make a dashboard level variable with the flag name to do breakdown in graphs by it.

    For context: I would like to have one dashboard for all AB tests of landing pages with the same set of graphs. A new flag is created for each AB test, so I have to change the breakdown by feature flag in each graph manually for each new AB test.

    • Andy
      3 months ago

      No. Breakdowns are specific to insights.

  • Marc
    a year ago

    Share with external users?

    Is it possible to share a single dashboard with external users who do not have access to the posthog org without publishing it?

    • Marcus
      a year agoSolution

      Hey Mohamed, publicly shared dashboards are accessible to anyone who has the correct link.

Was this page useful?

Next article

User paths

User paths are a type of insight that enable you to follow users along their journey through your product and determine where the biggest drop-offs are. You can learn the following from paths: Where users are getting confused or stuck. Which parts of your app people are actually using. Why users aren't discovering new features. Where new users are landing into your marketing website. How to create a paths insight Click Product Analytics on the left sidebar Click the + New insight button…

Read next article

PostHog.com doesn't use third party cookies - only a single in-house cookie.

No data is sent to a third party.

Ursula von der Leyen, President of the European Commission